Reporting and analytics

Twenty-eight reports, grouped by the question you're actually asking.

RingUps ships 28 standalone report pages plus a reports hub, and 30 report datasets that export to CSV. They cover sales, deposits, balances owing, appointments, floor stock, the workroom and the people who sell. Open a page, set a date range, and the export calls the same query the screen just ran.

28
report pages, plus the hub
30
datasets that export to CSV
7
questions the hub answers, one page each
A boutique owner in a blush suit crouching in front of a rail of white bridal gowns, with gown design sketches laid out on the concrete floor around her.
Cande Bridal Boutique, Kelowna, British Columbia. Every figure on this page comes from that store or from the code that runs it.

Why does a store with eighty-five reports still keep a spreadsheet?

Bridal Web Solutions is not a thin product. It ships about 85 reports across 156 pages and dates to 2006. Depth is not what is missing. A report is only as good as the fields underneath it, and depth you never finish configuring is not capability: Bridal Web itself flags 14 of Cande Bridal Boutique's 22 primary suppliers as never fully set up, and 82 categories hidden.

So the owner opens four reports, disagrees with all four, and rebuilds the number in a spreadsheet. Which deposits are still owed a gown. What went out the door in March. Whether the rack of samples from two seasons ago has earned its space.

RingUps answers those in a hub grouped by the question rather than by the feature name. Each report has its own page, its own date range, and its own CSV, and the export calls the same query the page just ran, so the download cannot disagree with the screen.

What question does each report answer?

Every report page in RingUps, grouped by what an owner is actually trying to find out.

The 28 report pages in RingUps, grouped by the question they answer. The reports hub adds a live revenue snapshot and an upcoming-weddings chart, which are dashboard furniture rather than exportable reports.
The questionThe reports that answer itExports
What did we sell, and how were we paid? Daily summary. Sales by category. Payment summary. Sales by supplier. Sales by size. Gross margins. Discounts. Voids and forfeits. Sales tax collected. Sales targets. 9 of 10
What is coming through the door? Appointment mix. Appointments by booking date. Actual appointment times. Unfilled appointment slots. Online-origin breakdown. 5 of 5
What is owed, in both directions? Balances owing (AR aging). Credits on account. Deferred sales. Signed contracts. 4 of 4
Who is performing? Sales by employee. Employee closing rate. 2 of 2
What is sitting on the floor? Inventory report. Floor stock aging. 2 of 2
What is in the workroom, and what went out the door? Alterations sales total. Delivery report. 2 of 2
Who is in the book, and how did she find us? Brides by stage. Referrals. Customer funnel and patterns. 3 of 3

What the reports hub looks like

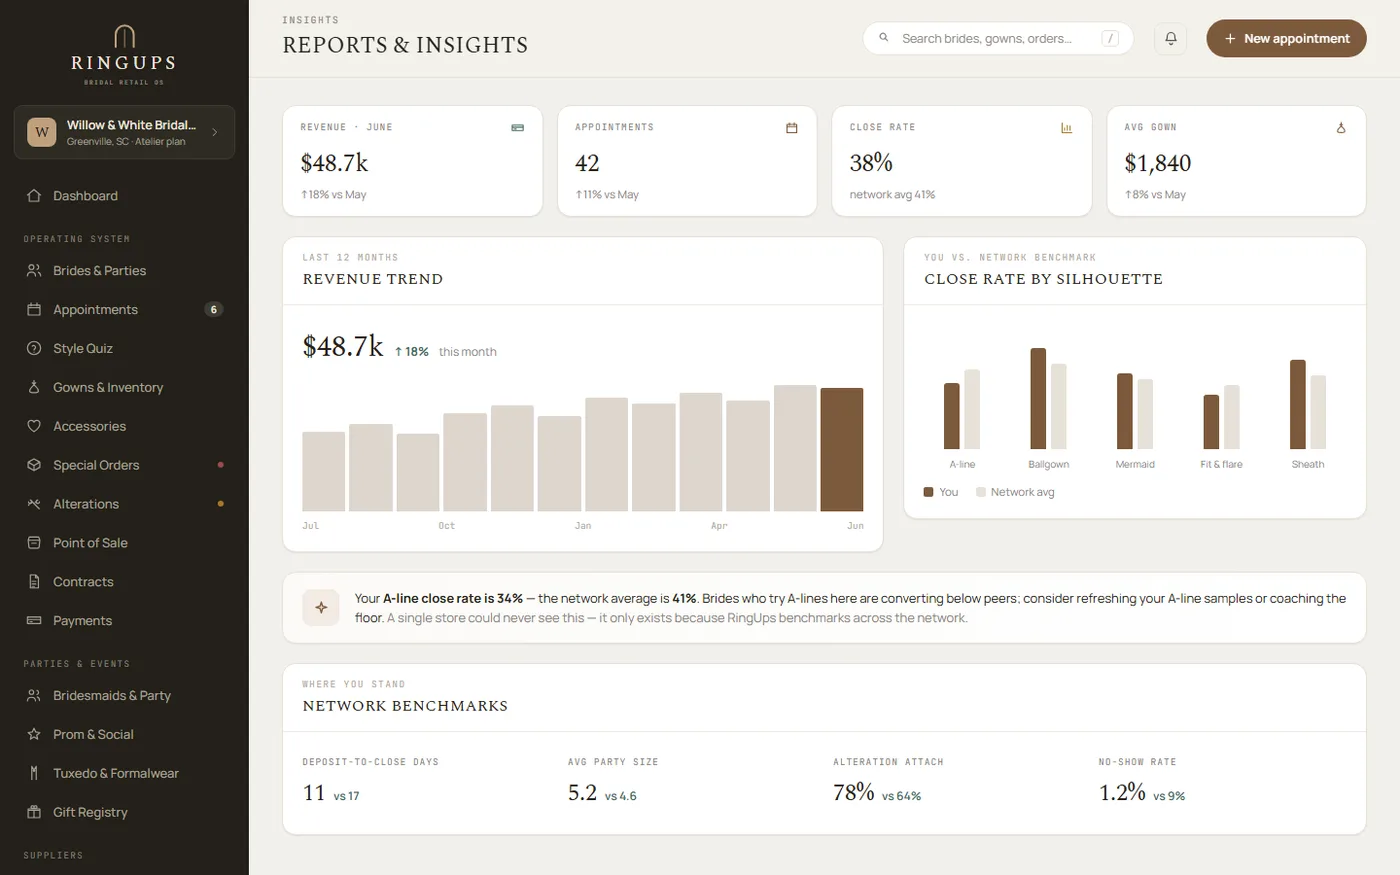
Revenue, appointments, close rate and average order value up top. A revenue trend and a close-rate-by-silhouette chart below, benchmarked against the RingUps network average so you know whether a number is good or just familiar.

The RingUps Reports and Insights hub: stat tiles for revenue, appointments, close rate and average order value, a revenue trend chart, a close rate by silhouette chart compared against the RingUps network average, an insight callout flagging a below-average close rate on a specific silhouette, and a network benchmarks row comparing dropoff-to-close days, average party size, alteration attach rate and no-show rate to the network
The reports hub in RingUps, shown with sample data.

A report is worth nothing if the rows under it were never reconciled

Moving Cande Bridal Boutique off Bridal Web Solutions meant reading its exports against each other. They did not agree. On one order, the sales tax export, the payments export and the line data gave three different answers. The category screen said 655 units in stock while the inventory export said 506.

The receivables number was the worst of it. Reversals had been recorded with both a negative quantity and a negative price, which reads back as a positive charge. 93 lines across 59 orders, worth $141,807.75, were wrong-signed. Roughly 78% of an apparent $384,659.89 receivable was an artefact of the export, not money a bride owed.

We found it, we refused to guess at it, and we told the owner not to collect on it. That is what a balances-owing report is for.

$3,253.05
Overstatement caught. Their sales export carried no tax at all, so tax was rebuilt on 1,391 orders and then corrected against a second report on 36 exception invoices.
228
Orders skipped rather than fabricate a bride to hang them on. 2,759 payments skipped for carrying no order number. The restraint is the proof point.
The import was not pristine, and we will not tell it that way. Every imported order landed with a picked-up status and zero tax, and both were backfilled by a numbered migration. Ask an owner to reconcile their current system against itself and see which number wins.

What the report library replaces

The deposit spreadsheet
The workbook where somebody tracks which deposits are still owed a gown, because the point of sale counted them as revenue on the day they were taken. Deferred sales does that from the ledger.
The end-of-day reconstruction
Sales by category, by employee and by payment method, plus deposits, discounts, credits and deliveries, are one page. The end-of-day print lives on the daily summary rather than in four tabs and a calculator.
The exports that disagree
One export endpoint, calling the same query the report page ran, scoped to your store by the database itself. There is no second path that can drift from the first.
The person who keeps it in their head
Which samples are old, who has a balance, which weddings are close. Written down, dated, and exportable by whoever is in on Saturday.
A boutique owner standing in front of a rail of hanging white bridal gowns on black hangers.
The reports exist so the floor can be walked instead of reconstructed.

How should a bridal store report on deposits it has not earned yet?

A bridal deposit is not revenue. The bride has paid, the gown has not been ordered, and if she cancels the money is a liability with her name on it. Most retail systems count the payment as a sale on the day the card clears, which is why the year-end figure has to be undone by hand.

RingUps books the deposit to a liability when it is taken and recognises it as revenue at delivery, on an append-only double-entry ledger. The deferred sales report shows deposit activity by month and the balance still held. The revenue snapshot on the reports hub separates what was collected from what has been recognised, which is the split a bookkeeper asks for first.

The caveat, again: this works from the day you start. The import did not replay the ledger, so deferred analytics read zero across imported history. How revenue is booked covers the mechanism in full.

Questions owners ask about the reports

How many reports does RingUps have?

RingUps has 28 standalone report pages plus a reports hub, and 30 report datasets that export to CSV. The hub groups them by the question they answer: what did we sell, what is coming, what is owed, who is performing, what is sitting on the floor, and what is in the workroom. Every page carries its own date range.

Can I export the reports to a spreadsheet?

Yes. 30 report datasets export to CSV from one endpoint that calls the same query the report page just ran, so a download cannot disagree with the screen you were looking at. Values beginning with an equals sign are neutralised, so a customer name cannot execute as a formula in Excel.

Run them on your own numbers

Send a year of sales history and we will open your real reports on the call. You will know exactly which of the twenty-eight earn their place before you pay for any of them.